DDoS mitigation shouldn’t be a black box. When your network is under attack, you need answers — not silence. You need to see what’s happening, what’s being blocked, and what your options are.
That’s why every CoreTech customer gets full access to our Client Portal — an enterprise-grade operations dashboard built for network security teams.
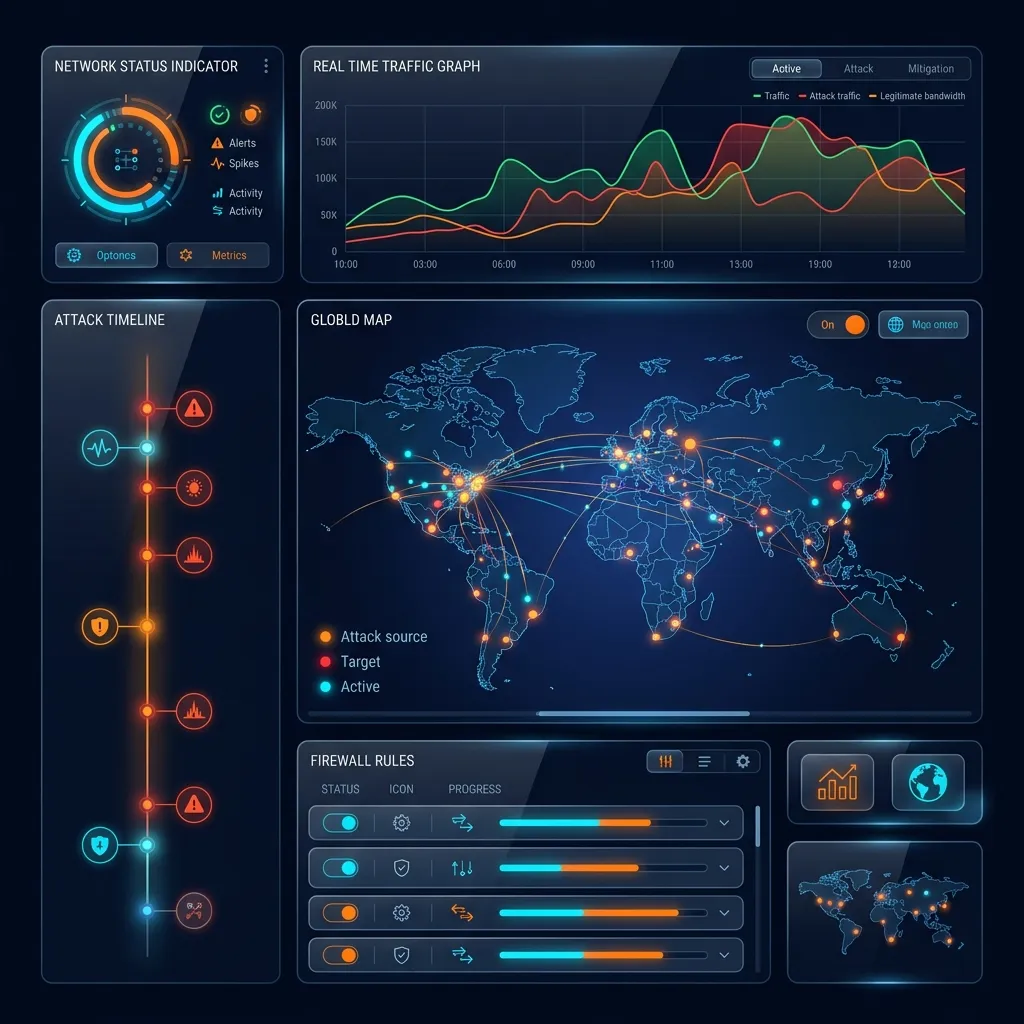
Real-Time Attack Dashboard
The moment CoreDetection™ identifies an attack, it appears on your dashboard within seconds. No delays, no waiting for email reports.
For every attack event, you see:
- Target IP — which of your addresses is being attacked
- Attack type — SYN Flood, UDP Flood, DNS Reflection, HTTP Flood, and more
- Severity level — CRITICAL, HIGH, MEDIUM, or LOW
- Live bandwidth and PPS — real-time metrics updated every second
- Source analysis — top attacking IPs, their networks, and geographic origin
- Traffic graph — a per-second visualization showing the exact attack waveform
- Detection scores — understand exactly why the traffic was classified as an attack
Every attack is tracked from detection through mitigation to resolution. You see the full lifecycle — including automatic detection when the attack ends.
Firewall Rule Management
Take full control of your protection with the built-in firewall management interface:
- Create custom rules — define packet filters for your protected IP ranges
- Protocol-level precision — filter by TCP flags, UDP ports, ICMP types, source IP ranges, and geographic origin
- Rule priorities — control the exact processing order of your filters
- Instant global deployment — rules take effect across all scrubbing nodes
For networks with pre-configured firewall rules, CoreEdge™ mitigation is instant — attack packets are dropped at the network card the moment they arrive.
Traffic Analytics
CoreTech provides real-time traffic visibility for all your protected IP addresses:
- Per-IP bandwidth graphs — see traffic consumption for every protected address
- Protocol breakdown — TCP, UDP, ICMP ratios visualized over time
- Geographic origin — where your traffic comes from on a global map
- Network-level analysis — which ISPs and cloud providers send traffic to you
- Historical data — review traffic patterns over days, weeks, or months
Many customers use this as their primary network monitoring tool — not just for DDoS visibility, but for understanding their overall traffic patterns.
API Access
Everything in the portal is available programmatically through our REST API:
- Query active attacks — get real-time attack data in JSON format
- Manage firewall rules — create, update, and delete protection rules via API
- Retrieve traffic metrics — pull bandwidth and flow data into your own dashboards
- Scoped API keys — generate tokens with specific permissions for different team members
If you can see it in the portal, you can query it via API.
Webhook Notifications
Get instant alerts the moment an attack is detected — delivered directly to your existing tools:
- Slack — dedicated channel alerts with full attack details
- Discord — real-time server notifications
- Microsoft Teams — enterprise SOC integration
- Custom HTTP endpoints — feed data into your SIEM, PagerDuty, or any automation platform
Each webhook payload includes everything your team needs: target IP, attack type, severity, bandwidth, packets per second, source distribution, and detection scores.
You receive notifications for:
- Attack start — the moment a threat is detected
- Attack updates — evolving metrics during ongoing attacks
- Attack end — confirmation that the threat has subsided
Ticketing System & SOC Support
Communicate directly with our SOC team through the integrated ticketing system:
- Open tickets from within the portal — no separate email threads
- Full conversation history — every response tracked and searchable
- Priority routing — critical tickets trigger our 10-minute response SLA
- 24/7/365 availability — our SOC team never sleeps
Account Management
- View and download invoices
- Manage account settings and contacts
- Review your service agreement and bandwidth commitments
- Track usage against your committed data rate
Multi-User Access and Role Management
Security teams rarely operate alone. The Client Portal supports multiple user accounts under a single organization, with granular role-based access control. Your NOC team can have read-only access to the attack dashboard and traffic analytics. Your network engineers can have full firewall rule management permissions. Your finance department can access billing and invoices without touching the security configuration.
Each user authenticates independently. All portal actions are logged with timestamps and user attribution. If a firewall rule change is made during an active attack, the audit trail shows exactly who made it, when, and what changed. This level of accountability is essential for post-incident analysis and for organizations operating under compliance requirements that mandate access logging for security systems.
No Black Box. Full Transparency.
We built the Client Portal because we believe you should know exactly what’s happening on your network. Every detection decision is explainable. Every firewall rule is visible. Every metric is queryable.
Your DDoS mitigation is only as good as your visibility into it.
Access the portal at portal.coretech.network
Not a customer yet? Start your free 10-day trial →
Want to see this in action?
Get a live demonstration of CoreTech's DDoS mitigation platform.