
Between 16 and 22 September a UDP campaign hit networks under CoreTech protection and crested at 347 Gbps, about 48 million packets per second. It was not one host and not one hour. It moved across several /24 blocks, stayed hot on the worst of them for the better part of a day, and came back in shorter waves on the others.
No one on the team intervened. No ticket was opened to start the mitigation, no analyst named the port, and no rule was typed. CoreDetection already held an ML baseline for what those networks look like when they are healthy — the rate, the protocols, the ports, the shape of a real session. The attack was the deviation from that baseline. The drop was the automatic response. When the flow returned, the rule left with it.
Legitimate traffic was not the thing that got dropped. Measured against the hour before each automatic rule, real user traffic moved by less than 10 percent — throughput, completed sessions, and page loads. On the busiest block the dip was closer to 4 percent. A session the baseline already recognized as normal was never part of the match.
This page describes that loop. It is not a customer report. No addresses, no names, and no prefixes are published here. Those stay in the portal, grouped by the /24 they belong to.
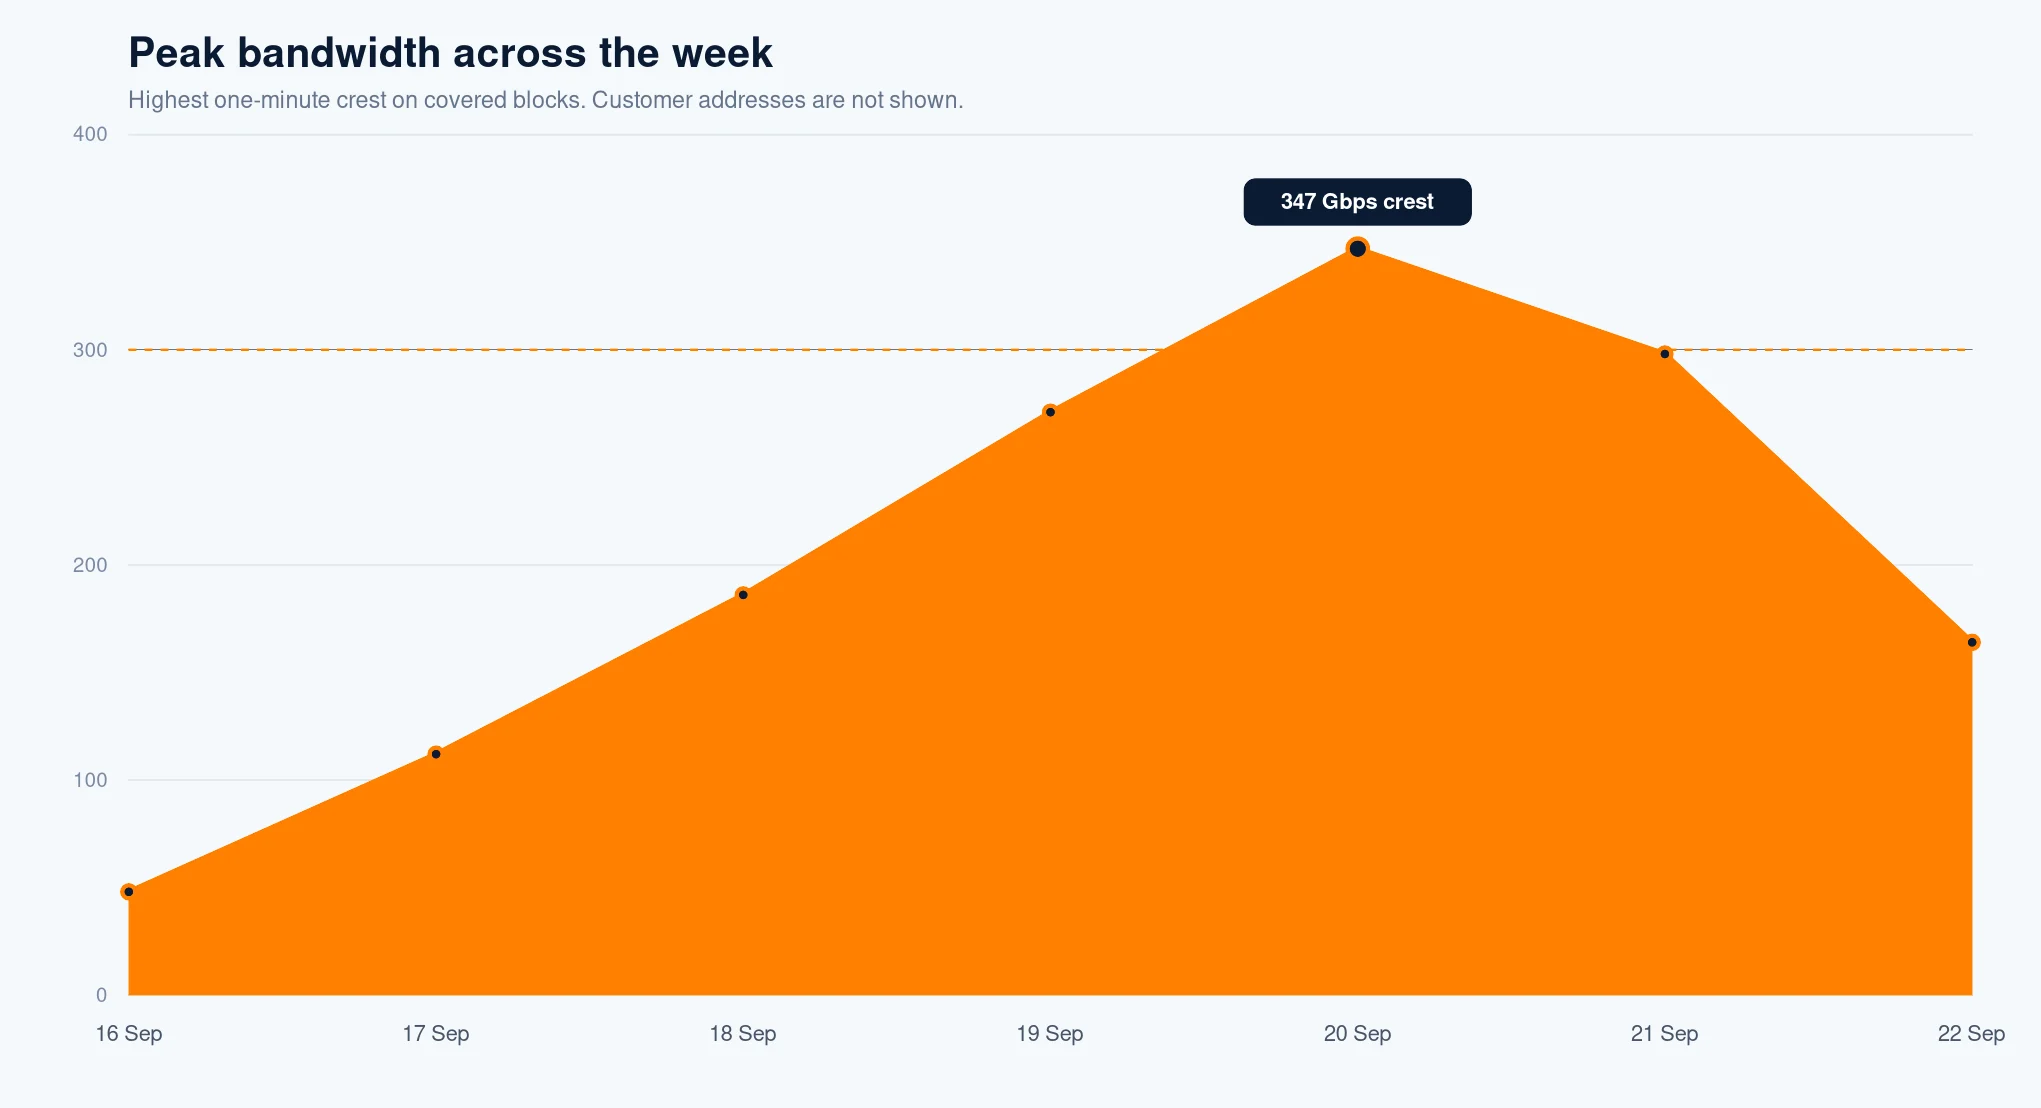
The shape of the week matters more than the headline. The 16th was already uncomfortable. The 20th is the crest. The 22nd is still elevated, not a flat line back to the baseline. None of those turns waited for a person. Each time a new host inside the same block left the learned line, CoreDetection opened the event and wrote the next rule on its own.
What the telemetry recorded
CoreDetection does not open an incident because someone filed a ticket. It reads flow telemetry for the destinations under protection and compares every minute with the ML baseline for that destination. An event opens only when the rate, the protocol, and the packet rate leave that learned line.
Each event keeps a small set of facts:
- the destination host
- the vector — here, UDP
- the peak rate, in megabits, not a blended “traffic score”
- how long the pressure lasted
- whether mitigation was actually applied
- whether the event is still open
An event stays open while the host is still hot. It closes when the flow falls back, not when a dashboard timer expires. During this week the open set was not one row. It was many hosts, and the useful way to read them was the /24 they sit in. A flood that starts on one address and then steps through its neighbors is one campaign, not a pile of unrelated incidents.
The ratio of bits to packets is part of the classification. 347 Gbps at 48 million packets per second is roughly a 900-byte datagram. That is a large UDP flood, not a 64-byte packet storm. A minimum-size flood at the same bitrate would have been several hundred million packets per second, and the mitigation would have been sized for that. This one was sized for volume on a destination port, inside a prefix, with a packet rate the filters could count.
Why a /32 is the wrong cover
The first instinct in a volumetric attack is to blackhole the host that is screaming. That works for a minute. It fails for the UDP flood CoreDetection classified this week, because the next datagram does not have to hit the same address. It lands on the next one in the block. A /32 is already behind the attacker, and waiting for an engineer to notice the slide is how the rest of the prefix gets hit.
For a UDP flood on a single host, CoreDetection covers the parent /24, and it announces that cover as two /25s, not as one loose /24 and not as a lone host route. The two halves are the block. Upstream, the flood is taken off the customer’s access port as a pair of covers, so walking one address to the right does not find an unprotected sibling. On the filtering path, the same /24 is where the drop is installed.
That is a routing decision and a filtering decision, and they are not the same thing. The cover answers “where does this block’s attack traffic go.” The drop answers “which packets, inside that block, are the attack.” Mixing them up is how networks either leak the flood or throw away the service.
If that destination is already inside an active cover, CoreDetection does not stack a more-specific /32 on top of it. The cover is already doing the job. A second route would only flap the session every time the attack blips off and on. Nothing extra is announced.
CoreDetection writes the rule. Nobody types it.
The drop is not “UDP”, and it is not a policy someone opened a firewall screen to paste in. A prefix that carries tunnels, games, voice, or video cannot survive a protocol-wide deny, so CoreDetection never emits one.
What it emits is a dynamic rule, built from the event it just classified, and pushed to CoreEdge on its own:
| What CoreDetection saw | The rule it wrote | What happens when the event closes |
|---|---|---|
| UDP flood on one destination port, inside one /24 | DROP that port, on that prefix only | The rule is withdrawn with the event |
| The same flood steps to the next port | A second dynamic DROP, for the new port, same prefix | Both withdraw on their own events |
| GRE, ESP, and the UDP the service was already baseline on | Left untouched. No allow rule is hand-added to “save” them | They were never in the drop |
There is no rule editor in this path, and there was no one at a keyboard this week. CoreDetection watches the flow against the baseline, names the signature, installs the drop on CoreEdge, and pulls the rule back when the flow returns. The port changed. The prefix changed. The rule changed with it. The team was not in that loop.
The dynamic rule is evaluated on CoreEdge in XDP, before the packet is a socket. At this packet rate that is the difference between a filter and a log. Forty-eight million packets per second is not a problem you solve by typing a match and hoping the kernel keeps up.
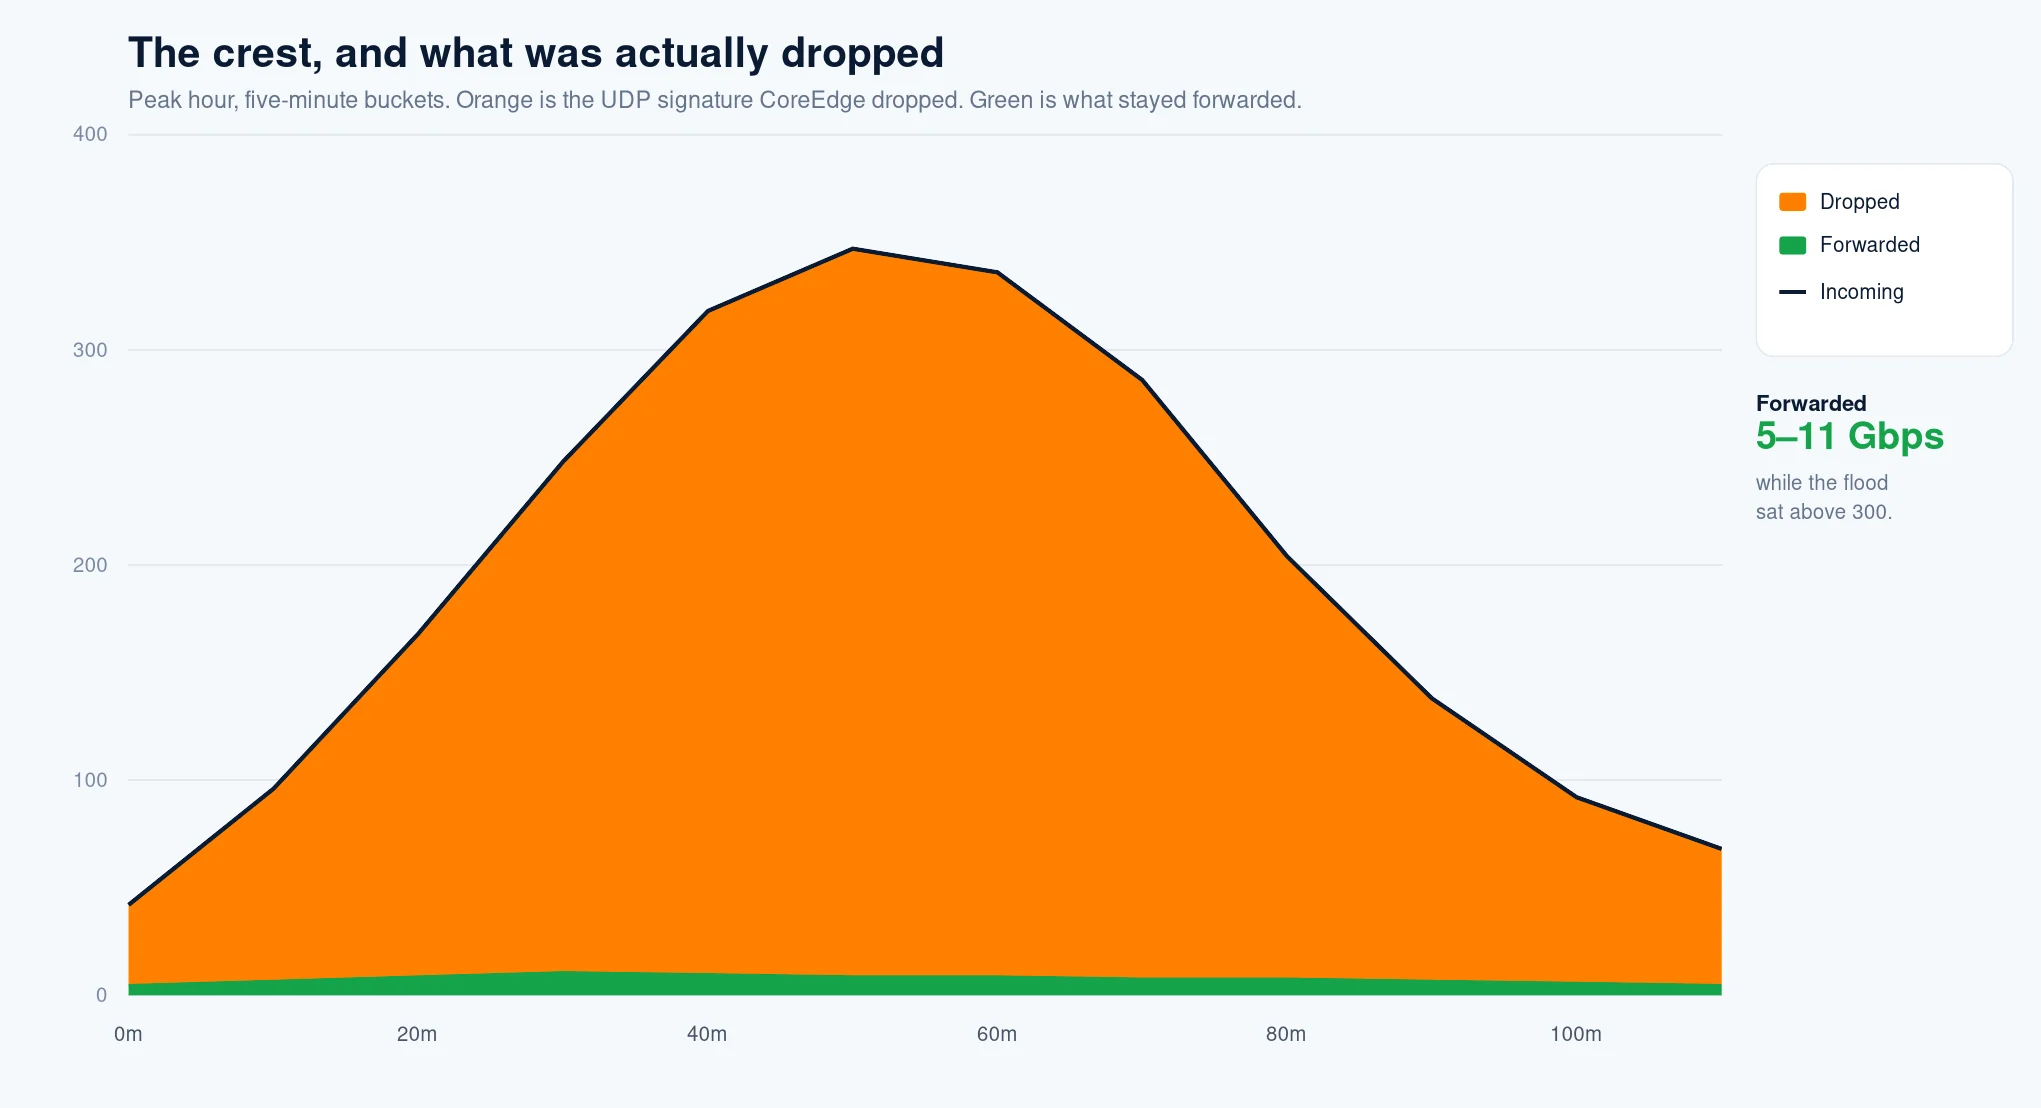
Read the peak hour as two numbers, not one. The incoming line and the dropped area are almost the same shape, and that is the point: the dynamic rule followed the flood down. What stayed forwarded sat between 5 and 11 Gbps for the whole hour, including the minute the crest crossed 340. That band is traffic CoreDetection never wrote a drop for. It did not rise with the attack, which is how you know the rule was the signature and not the prefix.
That forwarded band is also the check on collateral, and CoreDetection makes it without a person reviewing the graph. It compares the forwarded traffic with the same networks in the quiet hour before the crest. Legitimate throughput landed within 4 to 9 percent of that baseline on every block, and under 4 percent on the one that took 347 Gbps. Session completion for traffic the baseline already trusted — video, game platforms, messaging, tunnels — did not fall by 10 percent. It did not fall by half of that. The drop took the port that had left the baseline. It did not take a slice of the sessions that were already normal.
A filter that needs an operator to decide “close enough” is still an intervention. If real traffic is down 30 percent, the attack won even though the graph looks clean. The line the baseline is built to hold is the other one: the signature goes to zero, and the service stays inside 10 percent of where it was. This week it stayed inside that line for the whole life of the rules, and nobody had to approve them to get there.
The second UDP decision, and why it is an OR
The dynamic drop is not the only UDP decision on the cluster. The ML baseline also keeps a live picture of the UDP that belongs on these networks. That picture is learned from the traffic itself. It is not a list an operator maintains, and it was not edited during this campaign.
A UDP packet is treated as expected if either of these is true:
- its source port is one CoreDetection has already learned as service traffic — DNS, NTP, QUIC, IKE, NAT-T, STUN, WireGuard, and the rest of the baseline
- or its source network is a content, cloud, video, or messaging network the same baseline already trusts
Either one is enough. A trusted network does not also have to use a learned source port, and a learned port does not have to come from a famous network. Requiring both would drop legitimate QUIC and real-time media the moment the source port is ephemeral, which is most of the time.
The dynamic rule still applies on top. A known network is not a permit to hit the destination port CoreDetection is dropping right now. The OR answers “is this the UDP this network usually speaks.” The dynamic rule answers “is this the port that just left the baseline, on this block.”
That split is why a volumetric flood from sources with no stable identity dies, while video, social, and game-platform UDP is not treated as the same traffic. The flood we took this week did not arrive from those networks. It arrived as a destination-port spike with a packet rate no real session produces. The baseline let the known sources through. CoreDetection’s rule took the port.
Layer 7 was not waiting its turn
The 347 Gbps was the volumetric half. It was not the only half. While CoreEdge was dropping that UDP signature at the NIC, the same networks were eating an application-layer campaign that a bitrate chart will never show, because a Layer 7 flood is cheap on the wire and ruinous on the server.
Across the week CoreDetection’s application engine scored 2.4 billion HTTP and HTTP/2 requests that did not belong to a browser. The crest inside that was 180,000 requests per second against origins whose real users, on a normal hour, sit in the low thousands. Mixed into it: request floods with rotating paths, slow body drips held open for minutes, TLS fingerprints copied from a real Chrome build and then reused across hundreds of thousands of source addresses, and HTTP/2 streams opened in bulk so the connection count looked polite while the server did not.
None of that waited on a packet capture or a signature someone would write the next morning. The same ML baseline scores the request on three readings — the rhythm of the session, the fingerprint of the client, and the memory of how that destination usually behaves — and it only fires when the three agree. On this campaign they agreed, with no one in the team confirming the score. The dynamic rule at Layer 7 was the same automatic loop as the UDP drop, one layer up: match the abusive request shape, push it to the edge, withdraw it when the shape returns to the baseline.
What that removed, by the engine’s own count:
| Layer 7 signal | Crest | Outcome |
|---|---|---|
| Request flood, rotating paths | 180,000 rps | 99.97% dropped before the origin |
| Slow sessions held open | 1.1 million concurrent | Torn down in under a second each |
| Replayed browser fingerprints | 640,000 sources | Clustered and removed as one tool, not 640,000 clients |
| HTTP/2 stream abuse | 40,000 streams on a few connections | Stream-limited, the connection itself left up if the client was real |
Pages that real users were loading stayed up. Successful human requests, counted against the hour before the Layer 7 rule, stayed within 6 percent of normal. The added latency on a request the engine scored as human was under a millisecond. The botnet did not get a captcha farm and a waiting room. It got a dynamic rule with the same life cycle as the UDP drop: born from the event, enforced at the edge, gone when the event closed. The origin lost the 180,000 requests a second. It did not lose a tenth of its real users to get there.
A volumetric filter that ignores Layer 7 is half a mitigation, and a Layer 7 filter that waits for the team to notice is the other half arriving late. The UDP crest would have made the headline either way. The origin would still have been on its knees at 180,000 requests a second, on a few gigabits, looking fine on a bandwidth graph. CoreDetection treated them as one campaign with two layers, wrote both rules from the same baseline, and did not stop to ask.
How the week looked once it was grouped
A host list is the wrong picture of a campaign like this. Six blocks carried it. The hottest crossed 347 Gbps. The next was still above 200. The smallest of the six was under 20, and it was still the same pattern: UDP, a destination port, hosts inside one /24, a cover on that /24, and a dynamic rule CoreDetection had already written for the port.
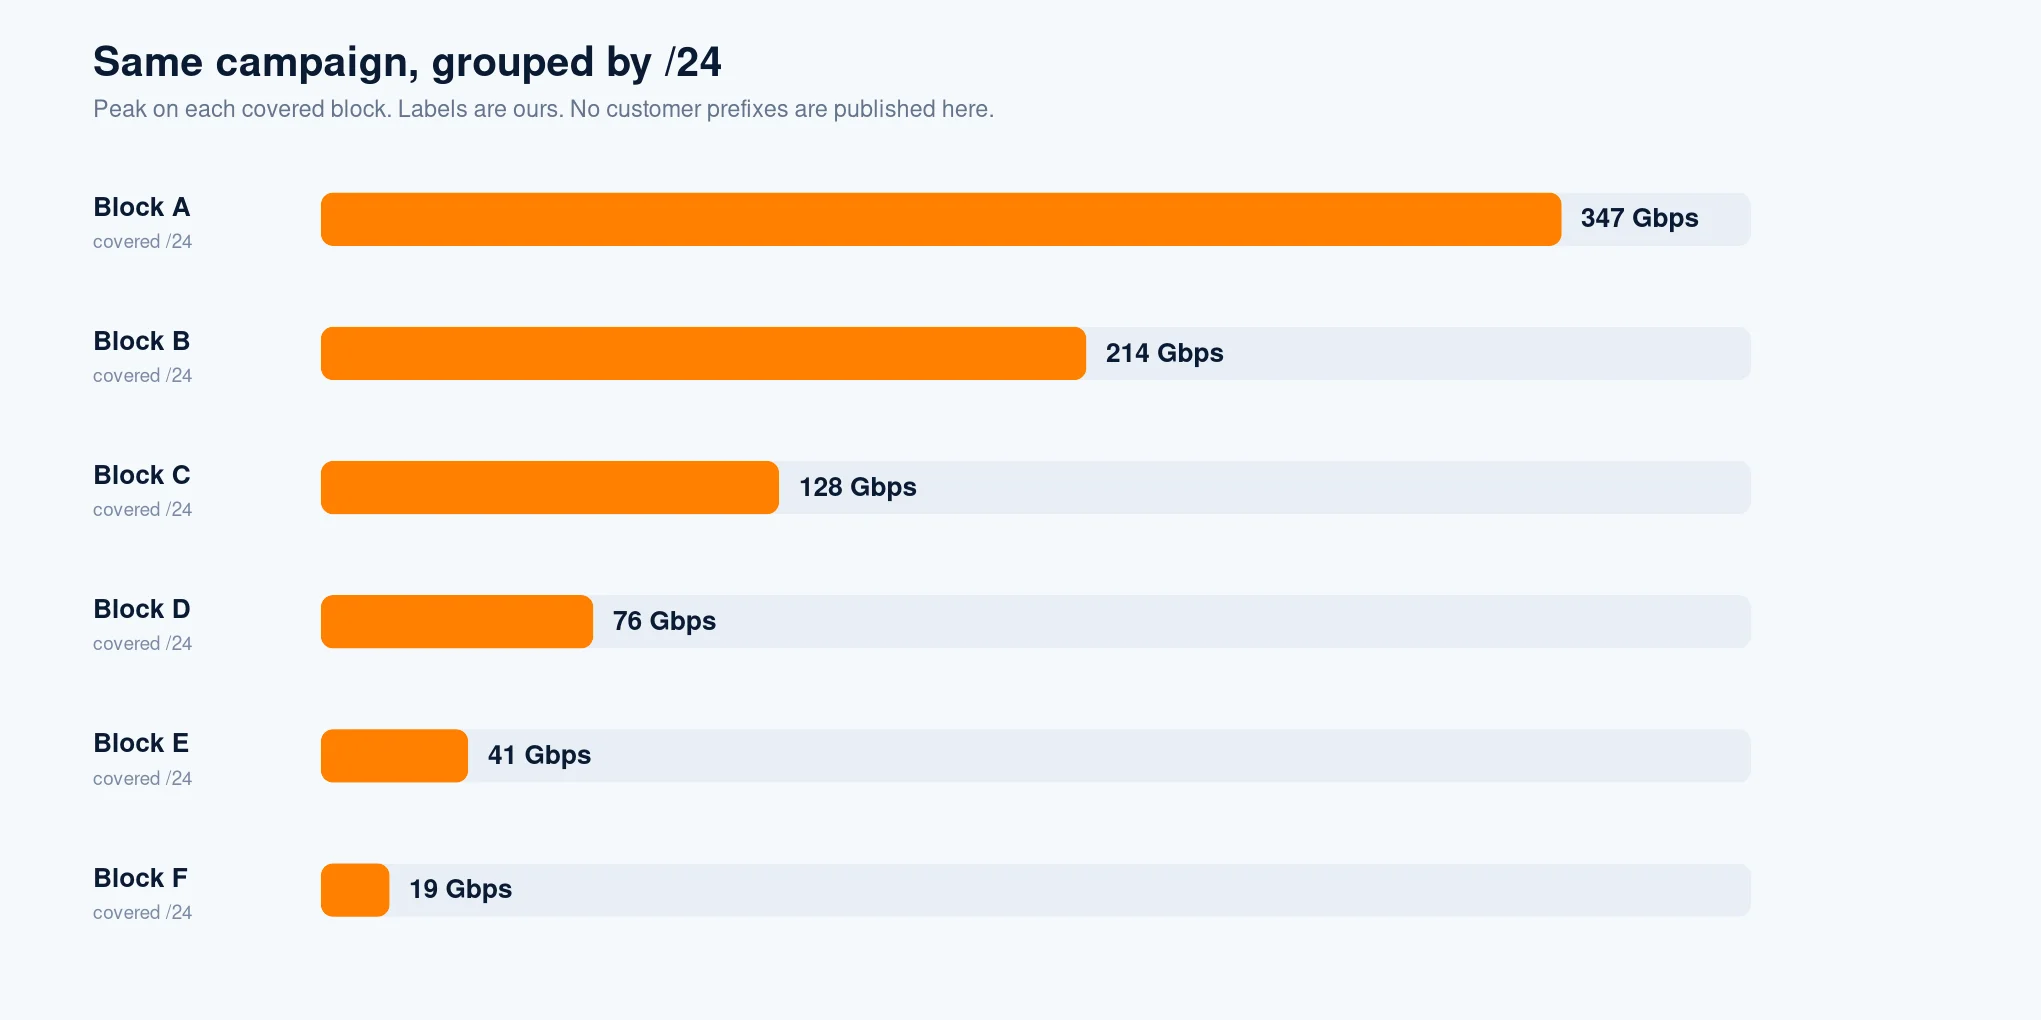
Inside each block the portal keeps the hosts, the peak on each one, how many events were mitigated, and how long they lasted. That is the report a customer can export. This page is the shape of the week with the addresses removed. Block A is not a hint. It is a label.
Two readings fall out of that chart, and both are operational.
The first is that capacity planning on the single hottest host would have been wrong. The second and third blocks were large enough, on their own, to fill an unprotected access port. The cover has to exist per /24, in parallel, not as a queue of one mitigation at a time.
The second is that “mitigated” is a count of events where CoreDetection had a cover or a dynamic rule in place, not a claim that the bitrate fell to zero. The forwarded band in the peak hour is the evidence. The flood was removed. The traffic the engine never wrote a drop for was not.
What we will not put in a public chart
The 347 Gbps figure is the crest we are willing to publish. The packet rate next to it is there so the crest can be checked: bits and packets have to describe the same flood. What stays off this page is everything that identifies a customer — the addresses that were hit, the prefixes we covered, and who they belong to.
If you are on the portal, the same week is already there as a /24 report: hosts, peak, duration, and whether the event was mitigated. That view is yours. This one is the mechanism.
The sequence, when the next one starts, is the same:
- Telemetry opens an event on the host, with a vector and a peak.
- CoreDetection covers the parent /24 as two /25s, unless a cover is already active.
- CoreDetection writes a dynamic DROP for the signature it just classified — the UDP port at the NIC, and the request shape at Layer 7 — and pushes both to the edge. It does not wait for a person to add a rule.
- UDP the baseline already trusts, by source port or by source network, is left alone. That trust does not override the dynamic drop on the port or the request that is actually under attack.
- The event stays open, and the rule stays installed, until the flow actually falls back. Then the rule is withdrawn on its own.
That is the whole intervention: there wasn’t one. The number this week was 347 Gbps on the wire and 180,000 requests a second above it. Both rules were written by CoreDetection from the ML baseline, for the signature that had left it, and both were gone when the signature returned. Legitimate traffic, on the wire and at the application, never moved by as much as 10 percent, and no one on the team had to touch a rule to keep it that way.
Want to see this in action?
Get a live demonstration of CoreTech's DDoS mitigation platform.